
REAL TIME 3D
DATA
VISUALISATION
The figures your business already has, in a form somebody actually reads.
GET A QUOTEBUILT FOR THIS PAGE
THREE THAT EARN THE THIRD AXIS
Most charts do not need three dimensions and are worse for having them. These three do: each carries a variable that a flat one cannot, and each is a chart organisations large enough to commission this actually ask for. The figures are invented. The shapes are the ones the real thing makes.
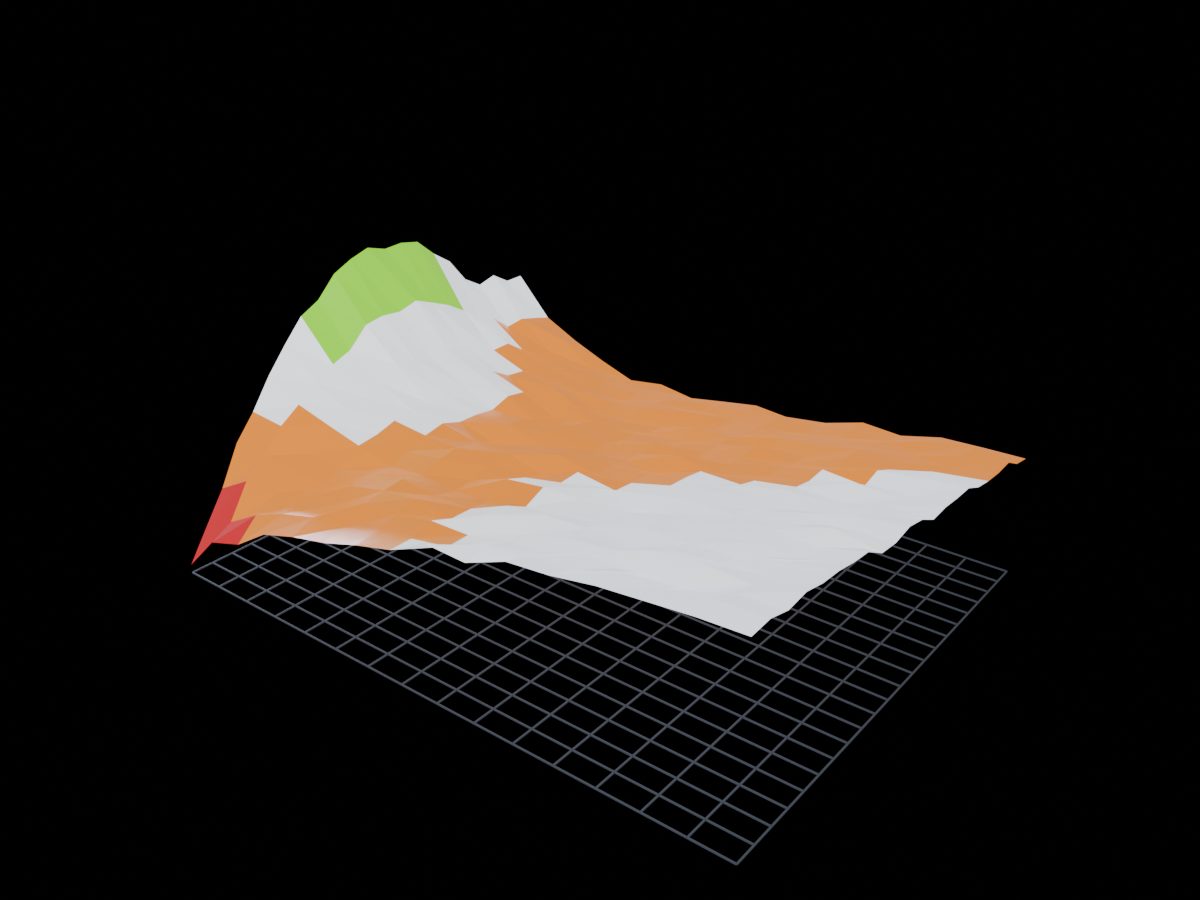
Rates by tenor, across two years. Every bank already has this as a flat heatmap and nobody enjoys reading it, because the thing they are looking for is the curve inverting and an inversion is a shape. Here the short end climbs through the long end and comes back down, and you can see it from the other side of the room.
WHAT IT INVOLVES
- 01
LIVE SOURCES
YOUR DATABASE, NOT A SNAPSHOT
- 02
LARGE SETS
HUNDREDS OF THOUSANDS OF POINTS
- 03
YOU CAN QUESTION IT
FILTER, ISOLATE, COMPARE
- 04
IT LEAVES THE SCREEN
EXPORT WHAT THEY FOUND